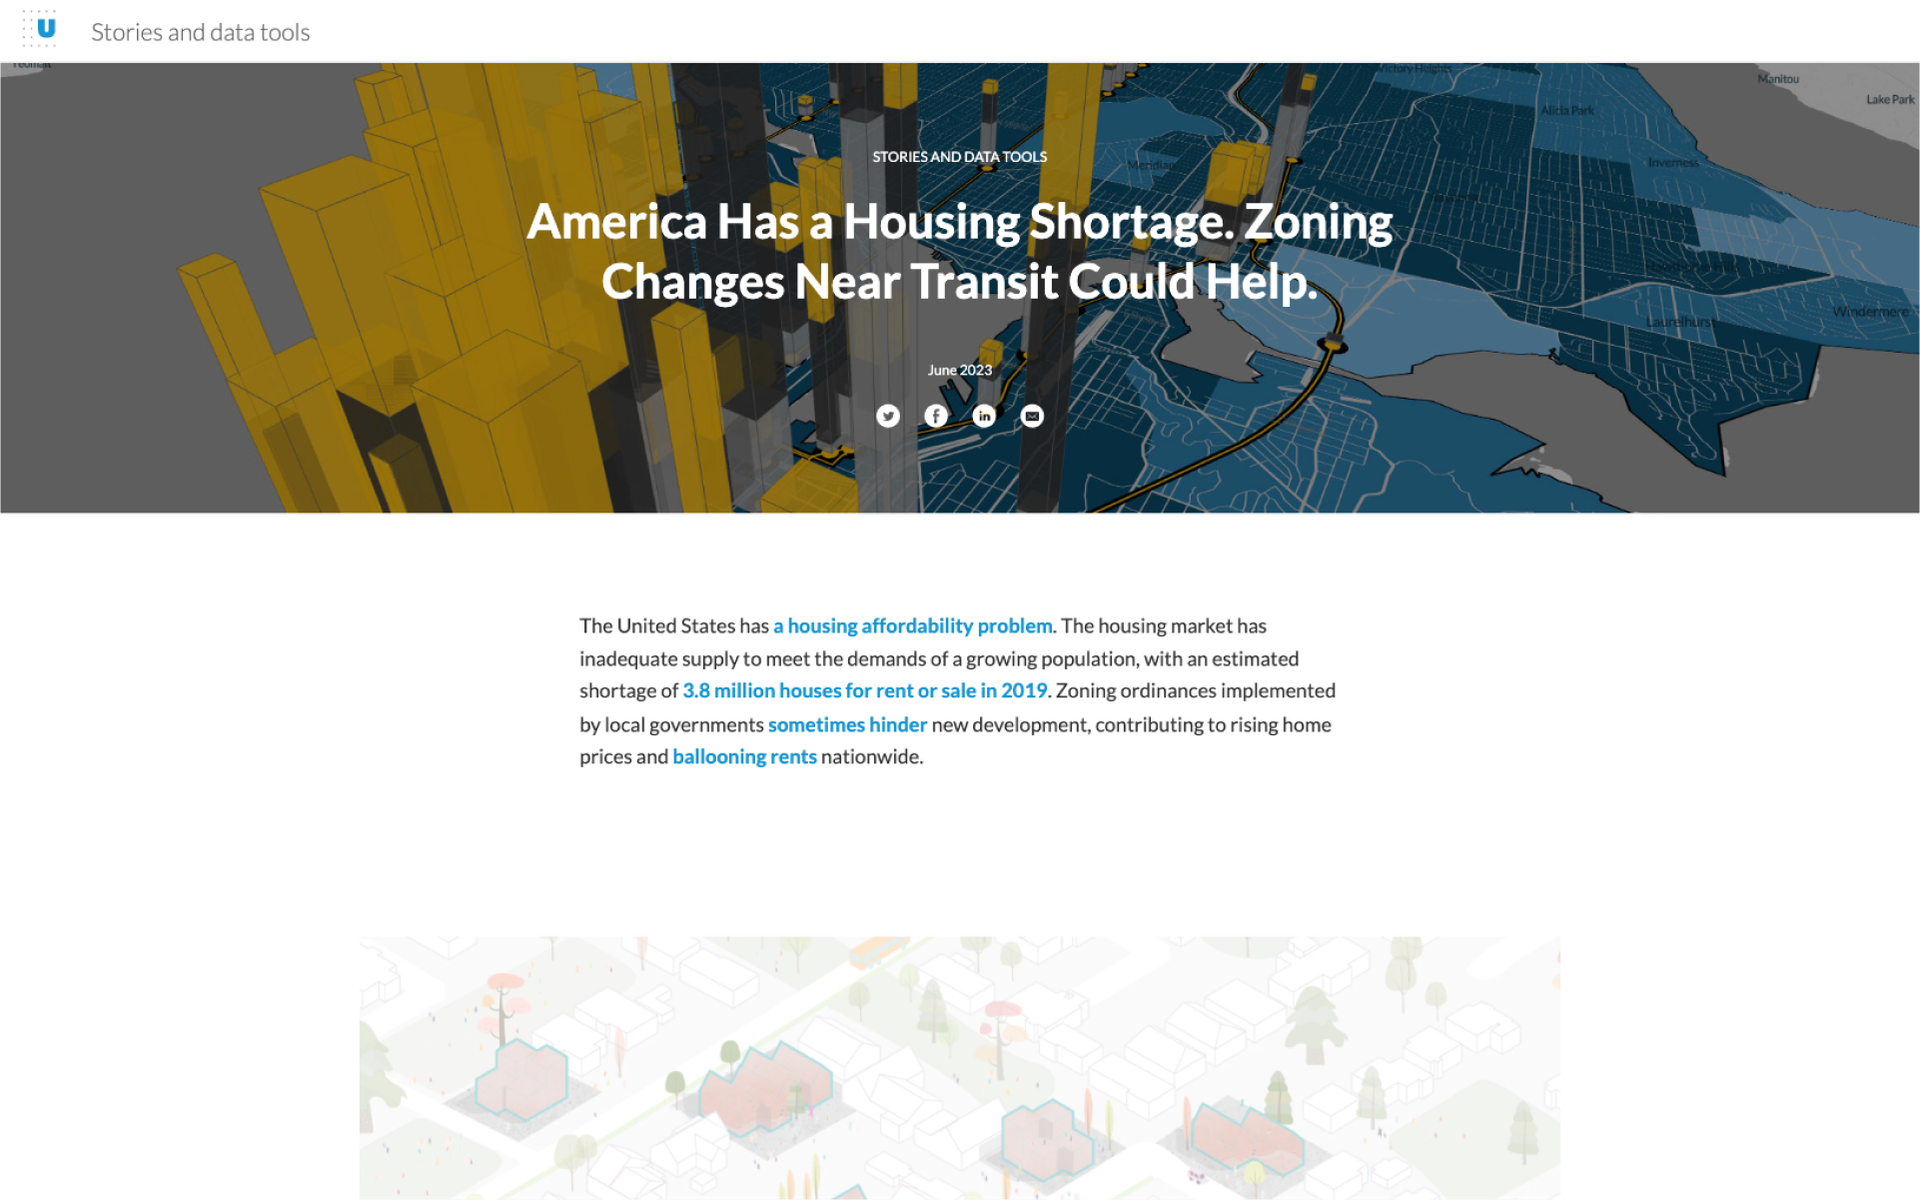
America Has a Housing Shortage. Zoning Changes Near Transit Could Help.

Zoning ordinances dictate what kind of housing can be built in cities nationwide. By changing zoning policies in metro areas like the Puget Sound, cities can address the housing shortage and increase demand for public transit.
In collaboration with the Urban Institute, we designed and developed a website to illustrate different zoning reforms under consideration across America, and provide viewers with an interactive way to explore how these reforms could affect housing availability in a real metropolitan area - the Puget Sound region of Washington.
Across America various zoning reforms are currently being debated as solutions to the growing housing crisis. As a case study, researchers with the Urban Institute explored the effects that such reforms could have on one of the nation's fastest growing metropolitan areas, the Puget Sound region of Washington, which includes the cities of Seattle and Tacoma. They reached out with an opportunity to collaborate on building an interactive website and visualizations that would allow viewers to explore this data first hand.
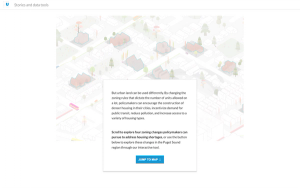
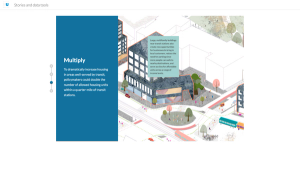
The challenge was to figure out how to use the Puget Sound data as a window into the much larger discussion surrounding housing availability and zoning reform nation-wide. We decided to start with illustrated, fictionalized neighborhoods to define and explain each of the different zoning reforms.
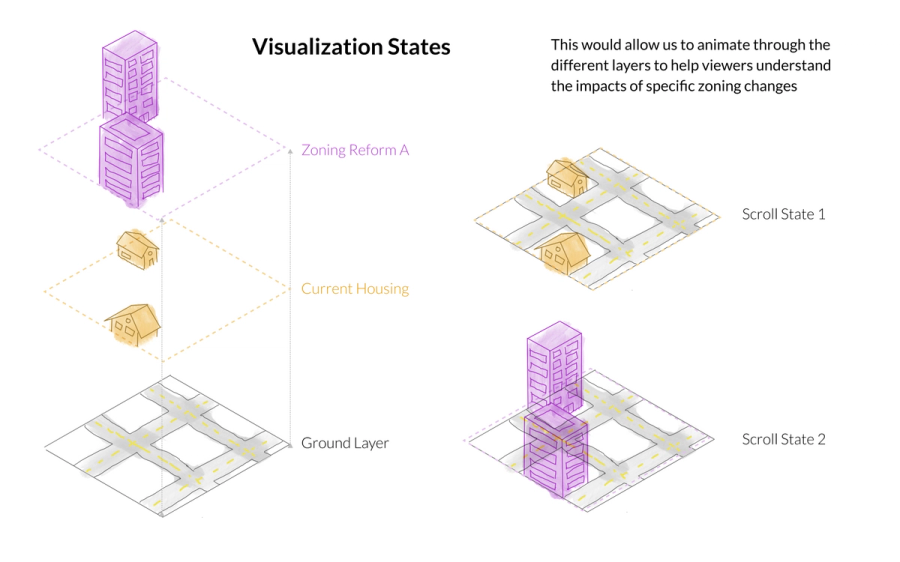
Illustrations were provided by To Be Done Studio and we built in subtle camera animations and annotations triggered via scroll to make the neighborhoods come alive.
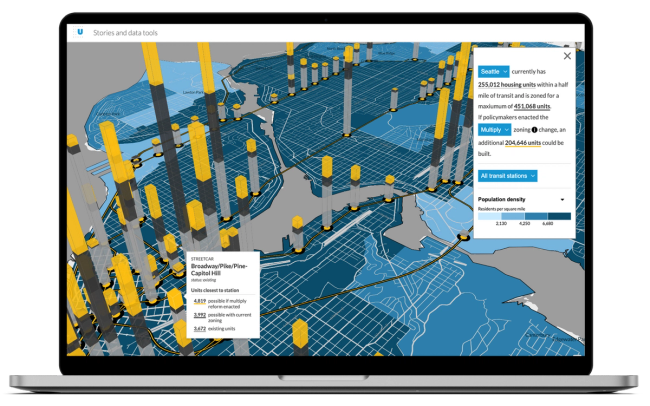
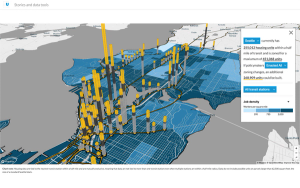
Next, we planned for the site to narrow its focus to highlight the Puget Sound data and give viewers a real-life case study of how these changes could affect housing availability. The challenge was to design a visualization that would quickly answer 1) what's the current housing availability, 2) what is needed, and 3) how would the proposed change address the need.
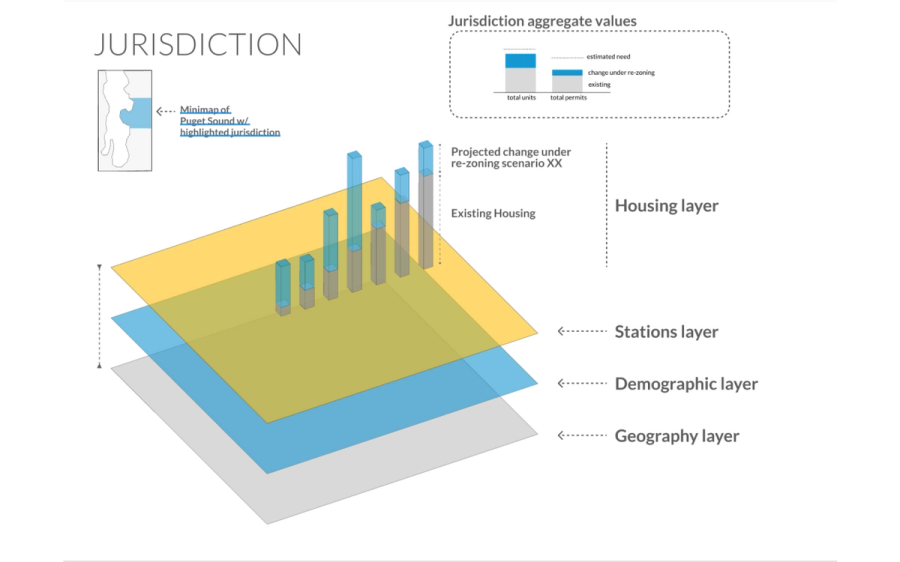
Moreover, we wanted these questions to be addressed across different resolutions, city-wide down to individual transit stations.
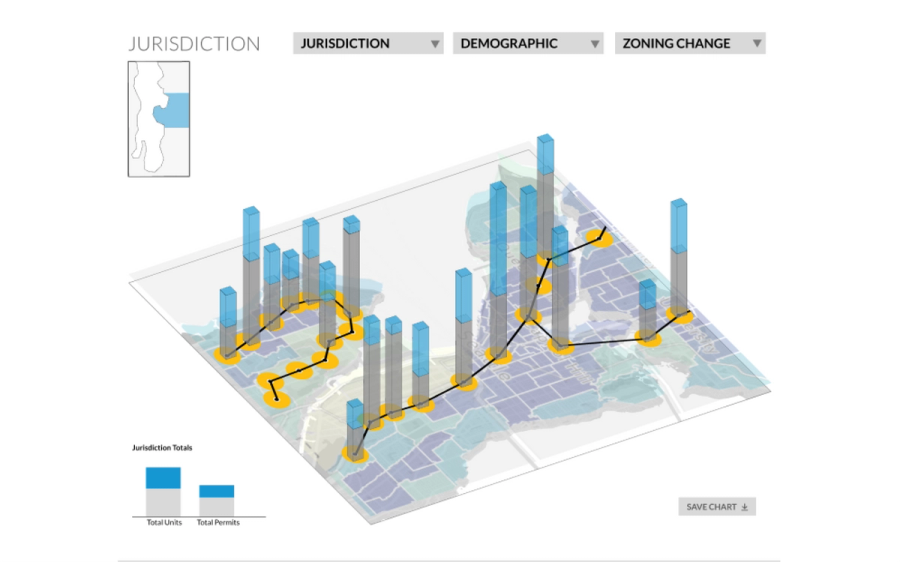
We designed and built a map that would allow viewers to fly between over 30 different cities in the region. Within each city, 3D columns at each transit station indicate existing and potential housing availability, and a choropleth overlay provides context by showing one of over a dozen demographic variables mapped to the level of census tracts. A collapsible control panel provides a way of choosing cities, zoning reform scenarios, transit station types, and demographic layers. We worked closely with Urban Institute designer Christina Baird and writer Wes Jenkins to give the final site a polished and consistent look and feel, and one that held true to their data and findings.
Decimal Point
1417 NW 54th St
Suite 372
Seattle, WA 98117
info@decimalpoint.studio