Petrochemical Facilities Explorer


We partnered with PSE Healthy Energy to design and build this interactive data tool: an in-depth exploration of nearly 1000 petrochemical facilities throughout the Gulf Coast and Ohio River Valley, with an emphasis on the impact these facilities are having on climate, public health, and equity in these regions.

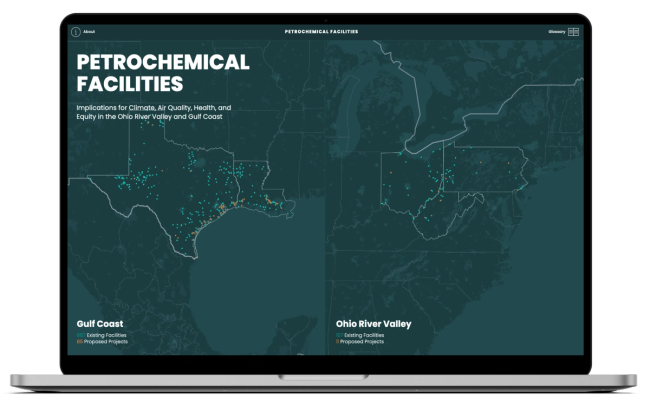
PSE approached us to design a tool to let viewers explore the rich data they had been collecting and modeling on 700+ existing, and 100+ proposed, petrochemical facilities throughout the Gulf Coast and Ohio River Valley. These data would be focused on highlighting the impacts that these facilities were having on climate as well as public health and equity across these regions. We knew the final version would be a map-based tool, but given that the focus was on 2 distinct, geographically separated regions, we first began designing an entry point that would allow visitors to see, at a glance, summaries across both regions, an option to choose which region to focus on.

We designed the tool so that viewers could see summary distributions of the most impactful metrics across multiple geographic zoom levels: Regions, States, and Counties. Within each zoom level, viewers can see the range of emissions (including greenhouse gases, criteria air pollutants, and hazardous air pollutants), the demographics of effected nearby effected populations, and modeled impact on mortality that the set of facilities has.

Zooming further in, viewers are taken to the level of an individual facility, where they can see additional details about that's facility as well as historical data on how this facility has been contributing to emissions over time.

Lastly, as this tool was meant for a general audience (in addition to policy makers, regulators, and advocates), we also included a dedicated landing page that provides an overview of the methodology and explanation of why these data matter to community healthy issues.

Decimal Point
1417 NW 54th St
Suite 372
Seattle, WA 98117
info@decimalpoint.studio