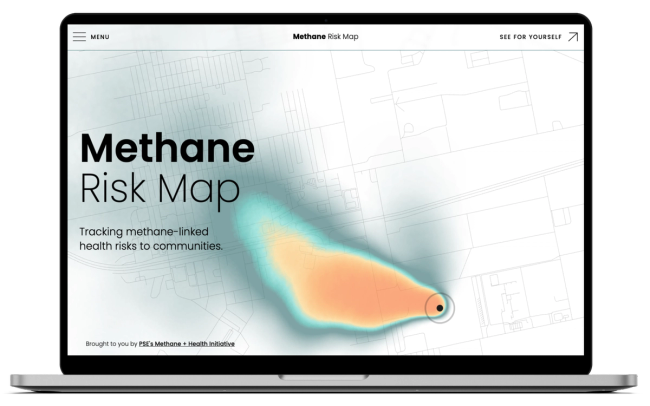
Methane Risk Map
The Methane Risk Map offers a fresh look and unprecedented level of detail on (1000+ and growing) hazardous methane events, and the public health risks they pose to the communities around them.
We partnered with PSE Healthy Energy to design and build the Methane Risk Map — a first-of-its-kind data tool that connects methane emissions with public health. Methane events don't travel alone; they're often accompanied by hazardous pollutants like benzene and hexane that have direct impacts on nearby communities. The Methane Risk Map offers unprecedented detail on over 1,000 hazardous methane events (and growing), showing where and when risk levels exceed safety and health thresholds.


The project involved close collaboration with PSE's team of atmospheric scientists, epidemiologists, engineers, and communications team to ensure the data was represented accurately and accessibly. We also solicited input from community groups to help shape a tool that would serve diverse audiences — from environmental regulators and policymakers to community advocates and concerned neighbors.


We handled the full scope of the project: an AWS backend and data processing pipeline to prepare visualization assets, Python and JavaScript for the interactive visualizations, and a Sanity-based CMS for ongoing content management. Design moved through low-, medium-, and high-fidelity stages in Figma, allowing us to iterate quickly with the research team before moving to development.
The result is a powerful platform that translates complex atmospheric modeling into clear, actionable information — helping communities, regulators, and advocates understand the real health risks of methane emissions in their area.
Decimal Point
1417 NW 54th St
Suite 372
Seattle, WA 98117
info@decimalpoint.studio