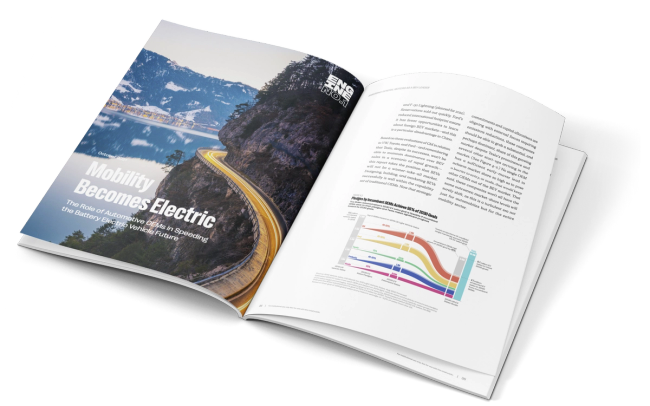
Mobility Becomes Electric
A set of 14 data visualizations to complement an industry white paper examining the progress and hurdles along the path toward electrification of the automotive industry.
The primary challenge was tracking down and standardizing supporting data across a diverse range of sources (e.g. International Energy Agency, EV-Volumes EV sales records, internal sales projections from automotive OEMs like Tesla, GM, Honda, etc). This was done via a collection of Google Sheets that could be shared and collaborated on with the client.
A few of the visualizations required building models to generate output data under various scenarios. We used Observable notebooks to test and visualize these models with the client before setting the final input parameters.
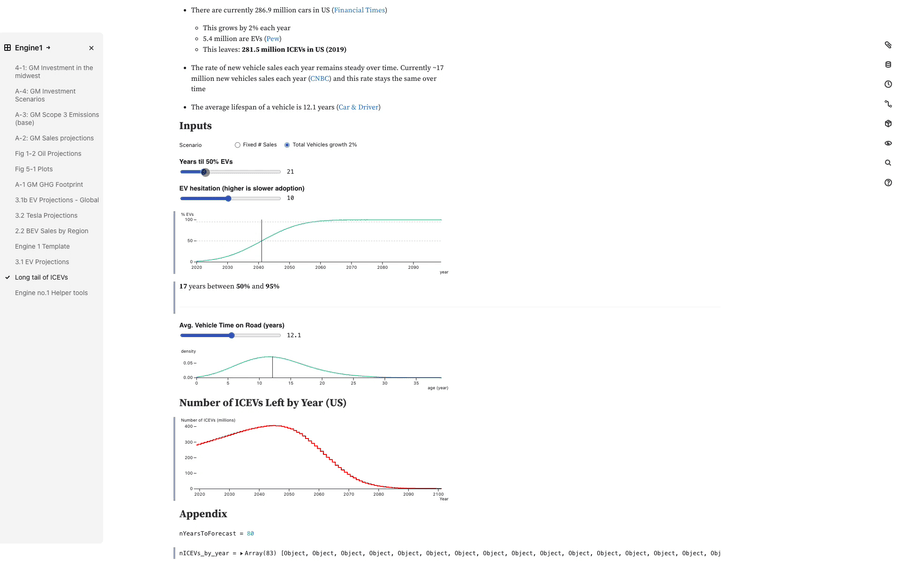
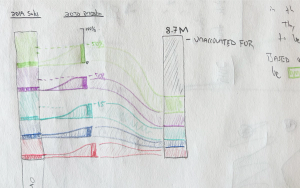
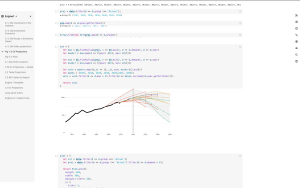
Once the supporting data for each figure was in place, we began to design the figures. The workflow went from 1) sketches on pen and paper, to 2) prototype and refine figures in code (using Observable), to 3) final polish and annotations in Adobe Illustrator.
The final set of 14 figures was shipped off to the client and embedded in the full report.
Decimal Point
1417 NW 54th St
Suite 372
Seattle, WA 98117
info@decimalpoint.studio